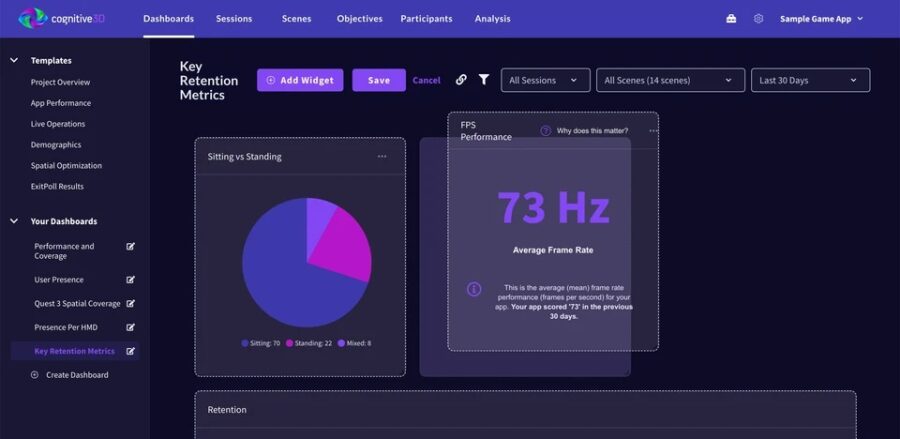
Cognitive3D, a provider of 3D analytics for immersive technologies, has this week announced the launch of its new Custom Dashboards feature. This addition to the company’s platform allows users to personalize the way they view and interpret spatial data, offering greater control over metrics, layout, and insights and enhancing the ability for users to draw actionable conclusions from data gathered in virtual and augmented reality (VR/AR) environments.
Cognitive3D’s platform turns spatial data into valuable insights to provide detailed analytics that measure human behavior within VR/AR experiences. The company’s analytics tools are used by more than 1,200 businesses to optimize products, improve training outcomes, and understand user interactions whilst in virtual spaces. Full 3D after-action reviews allow companies to capture and analyze nuanced behavior in ways that traditional analytics tools cannot.

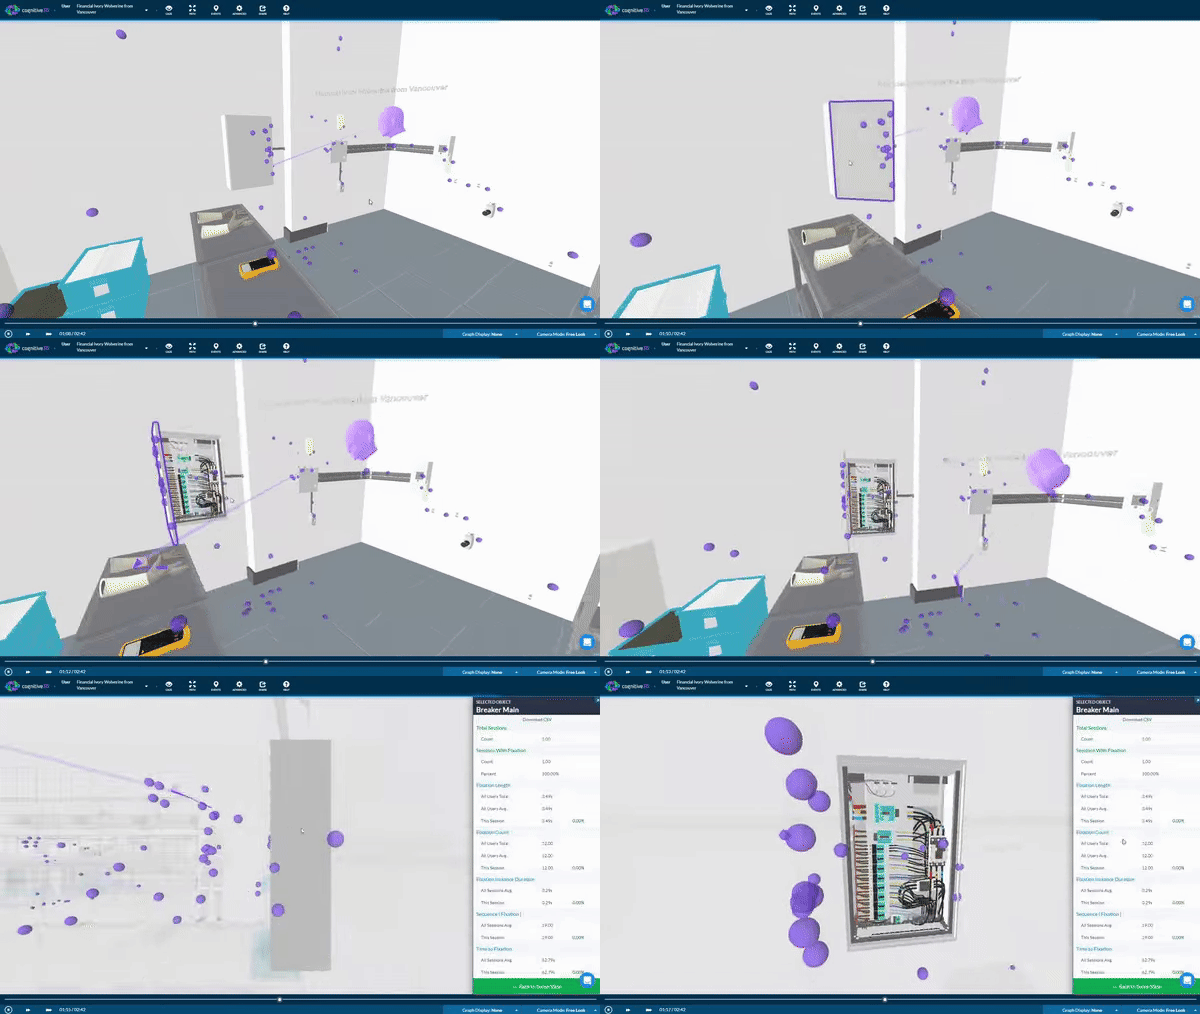
User interactions in VR can be tracked and visualized within the Cognitive3D platform.
With applications ranging from training simulations to consumer research, businesses are able to leverage data captured with Cognitive3D’s platform to provide more context to user sessions. Whether being used for assessing user performance and tracking progress over time, discovering pain-points within immersive training experiences, or gathering player data from VR games to better understand in-game behavior to improve VR gaming titles, businesses can measure eye tracking data, assess user situational awareness and focus, and identify areas where users may struggle. The platform also offers tools for reviewing full 3D reconstructions of entire sessions, helping evaluators assess performance remotely and in detail.
With the newly launched Custom Dashboards feature, the platform now offers a more tailored approach to data presentation, providing greater flexibility and precision to Cognitive3D customers. The update allows for the creation, editing, and sharing of personalized dashboards that can be tailored to the specific needs of different teams or projects. The dashboards allow users to not only track standard metrics like comfort scores or presence scores, but to also integrate custom queries that focus on the data that is most relevant to their objectives.

“The launch of Custom Dashboards is an exciting step forward for Cognitive3D and our users,” said Tony Bevilacqua, Founder and CEO of Cognitive3D. “As our platform surpasses 1,200 organizations, we see a growing appetite for data and insights. Custom Dashboards give customers the power to design and share their own uniquely tailored data presentations, which tell a more concise story to both internal and external teams. This new feature is a reflection of the maturity of our category and our ongoing commitment to meet our customers where they are on their analytics journey.”
The company has also integrated some of these dashboards with external data visualization tools like Microsoft PowerBI (an interactive data visualization software product), ensuring that key stakeholders can access spatial insights where and when they need them. This externalization is particularly important for companies that need to disseminate complex spatial data to broader audiences, making insights from organizations’ immersive technologies more accessible and actionable, allowing them to focus more closely on the metrics that directly impact operational efficiency and user experience.
Cognitive3D’s Custom Dashboards are available now as part of the company’s broader 3D analytics platform. For more information, visit Cognitive3D’s website.
Quelle:
Foto: Cognitive3D


